Voting Analysis 
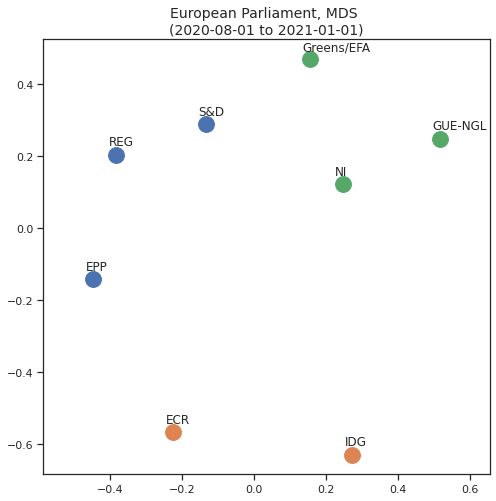
MDS plot of the distance between EU political groups.
I’ve made some decently complex analysis – with the challenge of making the end result as easily understandable and actionable as possible – on how parties vote and what does that voting tells us about their relative position in the ideological spectrum. I’ve shared the result using Jupyter Book here (in Portuguese), and it has a smaller (in the sense that the explanations are terser, but it’s actually the same) section on how the same approach applies to European Parliament political groups, so perhaps start there!
Background 
What does the voting record – and only that – tells us about the proximity and positioning of political parties? Considering that political activity, in the form of proposals and support/rejection of them in voting sessions, is (in theory) the way that the platform of each party gets expressed, what can we infer if looking exclusively at that record?
This analysis started when a discussion about the attributed seats of recently elected parties to the Portuguese parliament caught on, understandably because sitting more to the left or to the right is a reflection of how the parties are perceived, even those that ostensibly refuse such classifications.
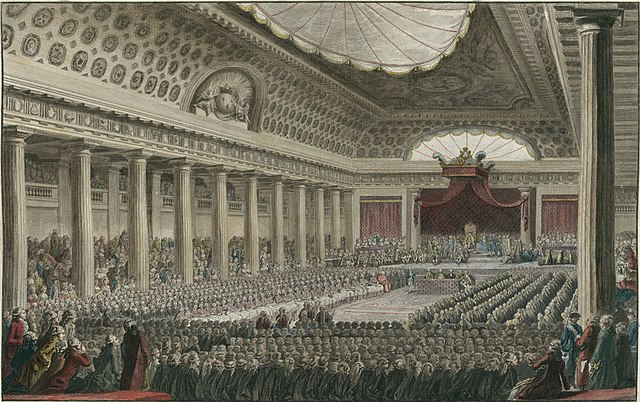
This is not new: the ideological proximity between different political parties is a hotly debated topic, with the absolute and relative positioning between them being part of the social debate. The physical seating location of those elected by parties in a national parliament is something that, since the 1789 National Assembly in France, carries substantial weight in itself, and the left/right divide (today also morphed into multiple compasses, quadrants, and other explanatory frameworks) continues to be an important source of political discussion.
Approaches to improve on the reliance on self-identification (often incompatible with existing majority perception, or simply inconsistent when considered as a whole) have used different methods, most of them dependent on the a priori classification of themes, expressions, language patterns, or positions, which are then used as qualifying criteria to determine the political positions of parties according with their voting record, often selecting a subset of votes determined to be particularly representative.
A new approach 
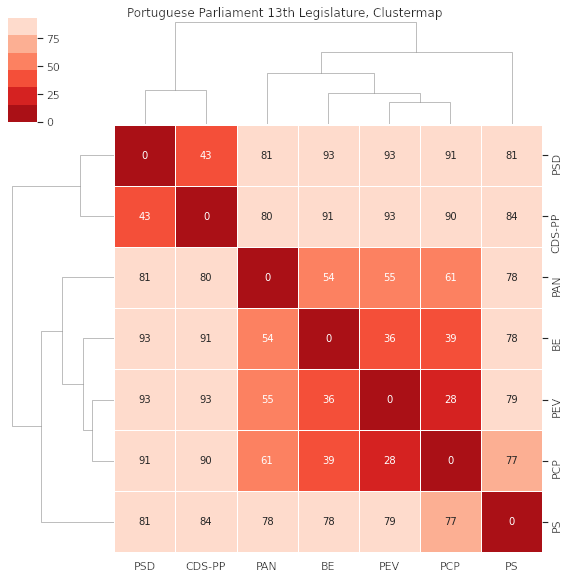
Clustermap based on computed distances.
The increased availability of open data allows the application of different analytical approaches to what is a privileged source of social expression: voting roll calls. We present an unsupervised method of determining pairwise distances between parties based exclusively on their voting behaviour, visualised through clustermaps. Furthermore, we explore how clustering algorithms (DBSCAN, Spectral Clustering) can be applied to determine grouping, and how dimension reduction through Multidimensional Scaling (MDS) provides an intuitive and automatable approach to visualise relative positioning through time, without the need to depend on the subjective classification or selection of proposals.
The results of this approach to the Portuguese national parliament and the European Parliament are presented, identifying that the tendency of most parties to position themselves at the centre of the political spectrum is challenged by the proposed visualisation of the voting record. The application of this method to multi-party parliamentary systems is discussed, and how technology and open data can play a role in the active political involvement of citizens.